The Conic Geometry of Rectangles Inscribed in Lines

Bruce Olberding and Elaine A. Walker (August 14, 2019)

This page contains supplementary graphics for our article, The Conic Geometry of Rectangles Inscribed in Lines.

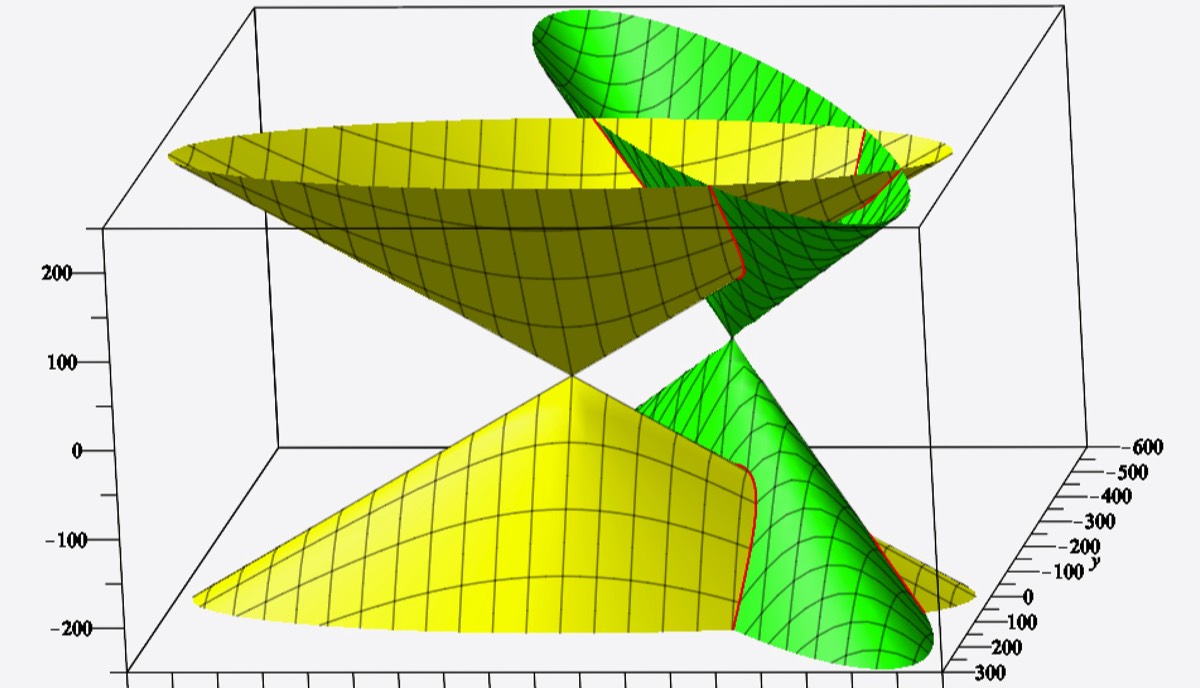
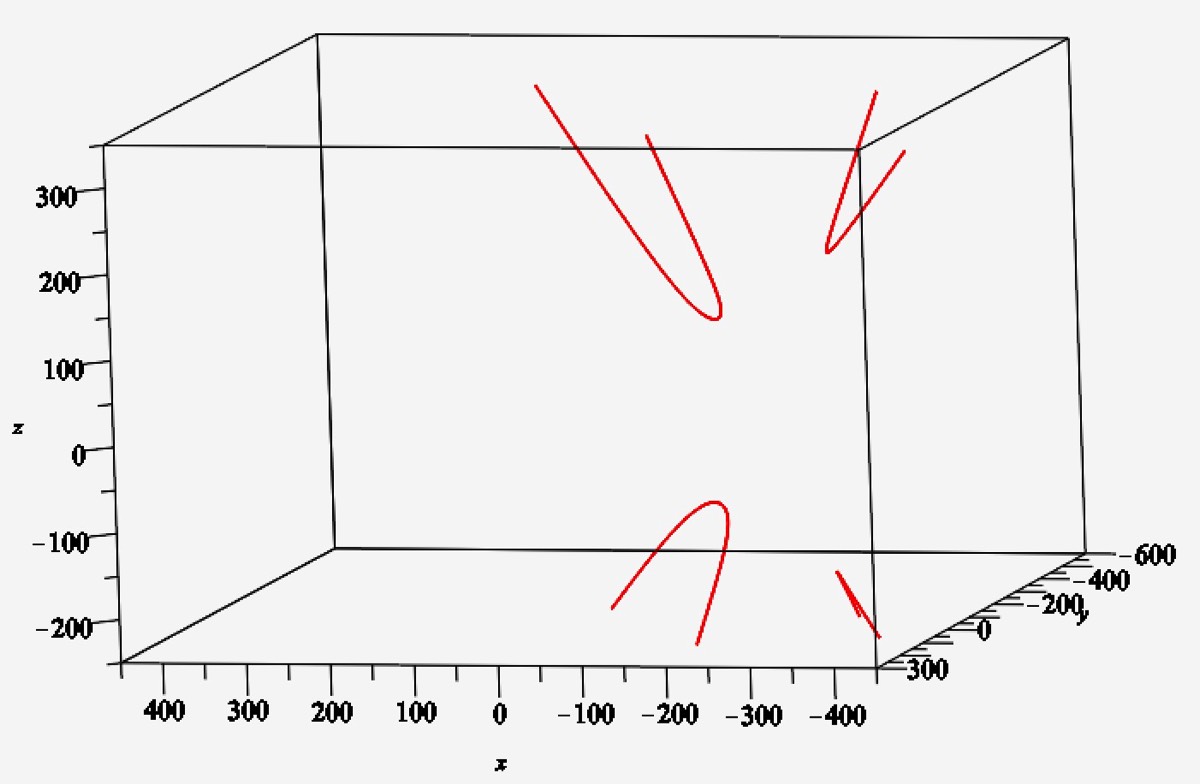
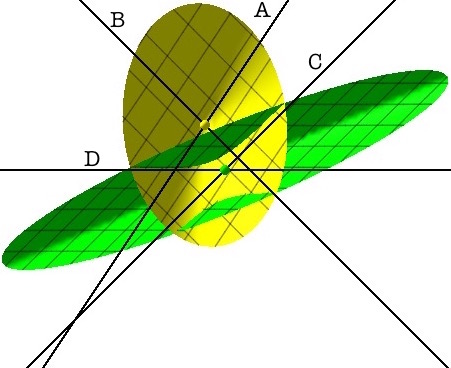
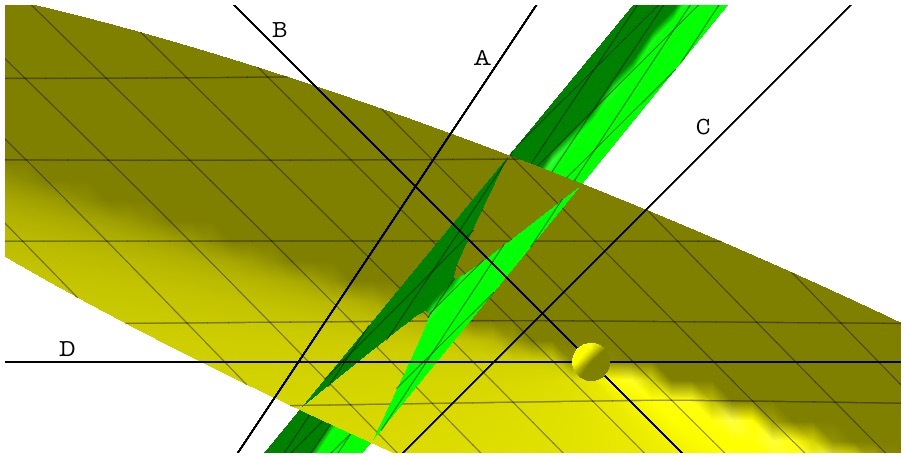
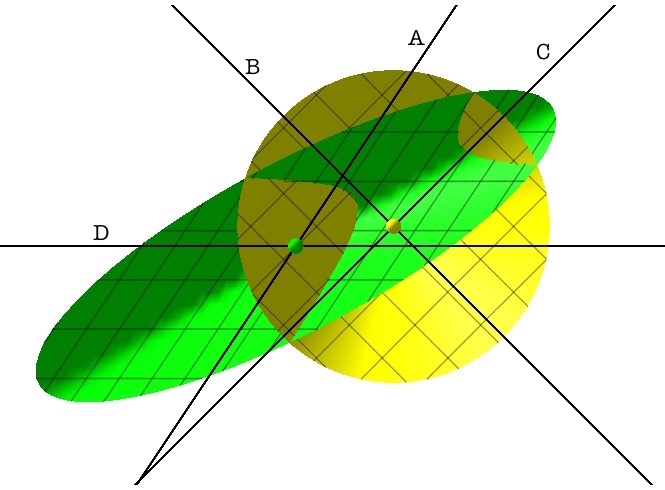
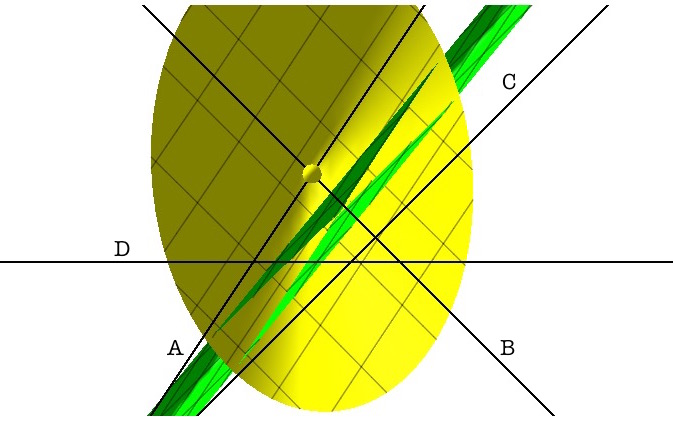
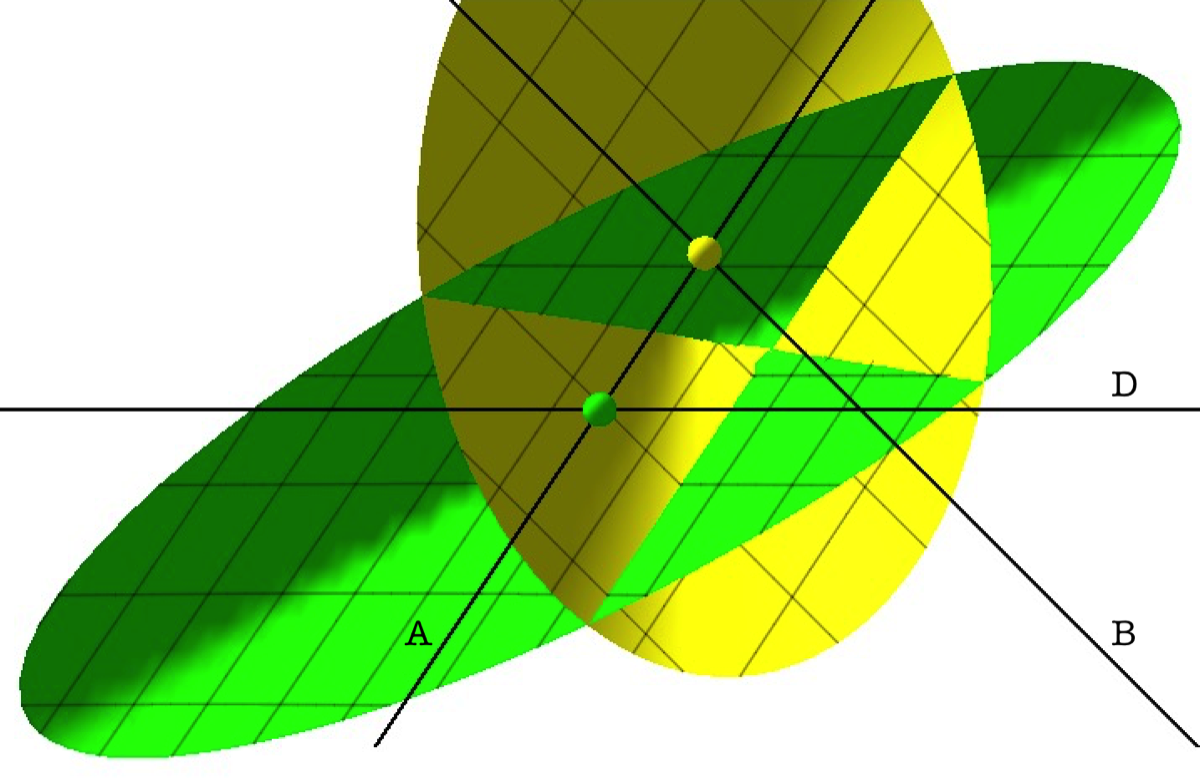
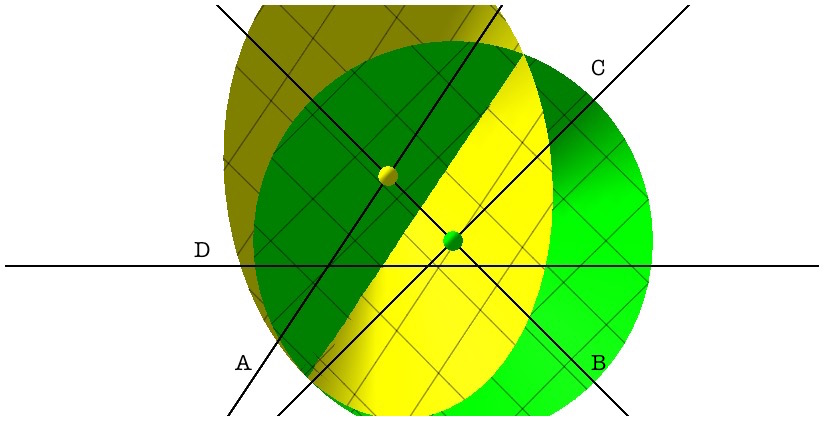
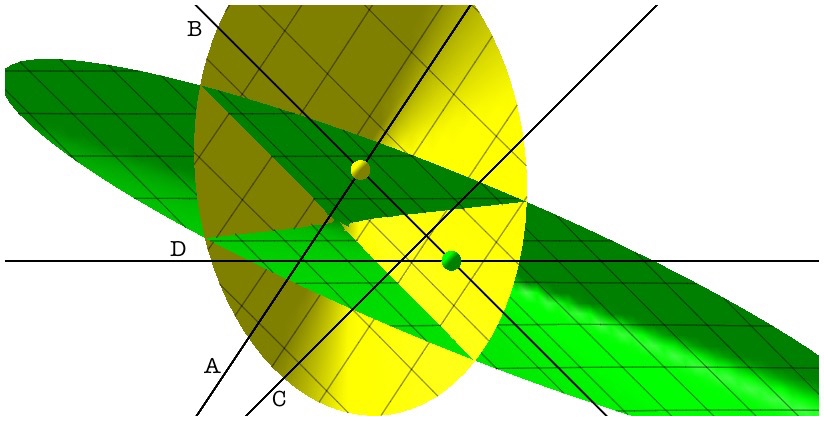
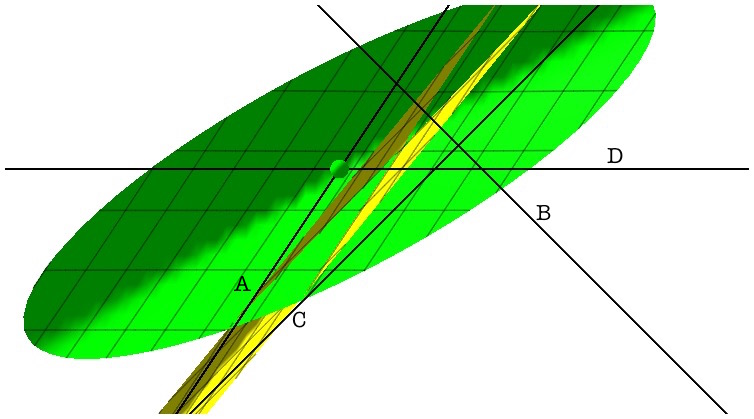
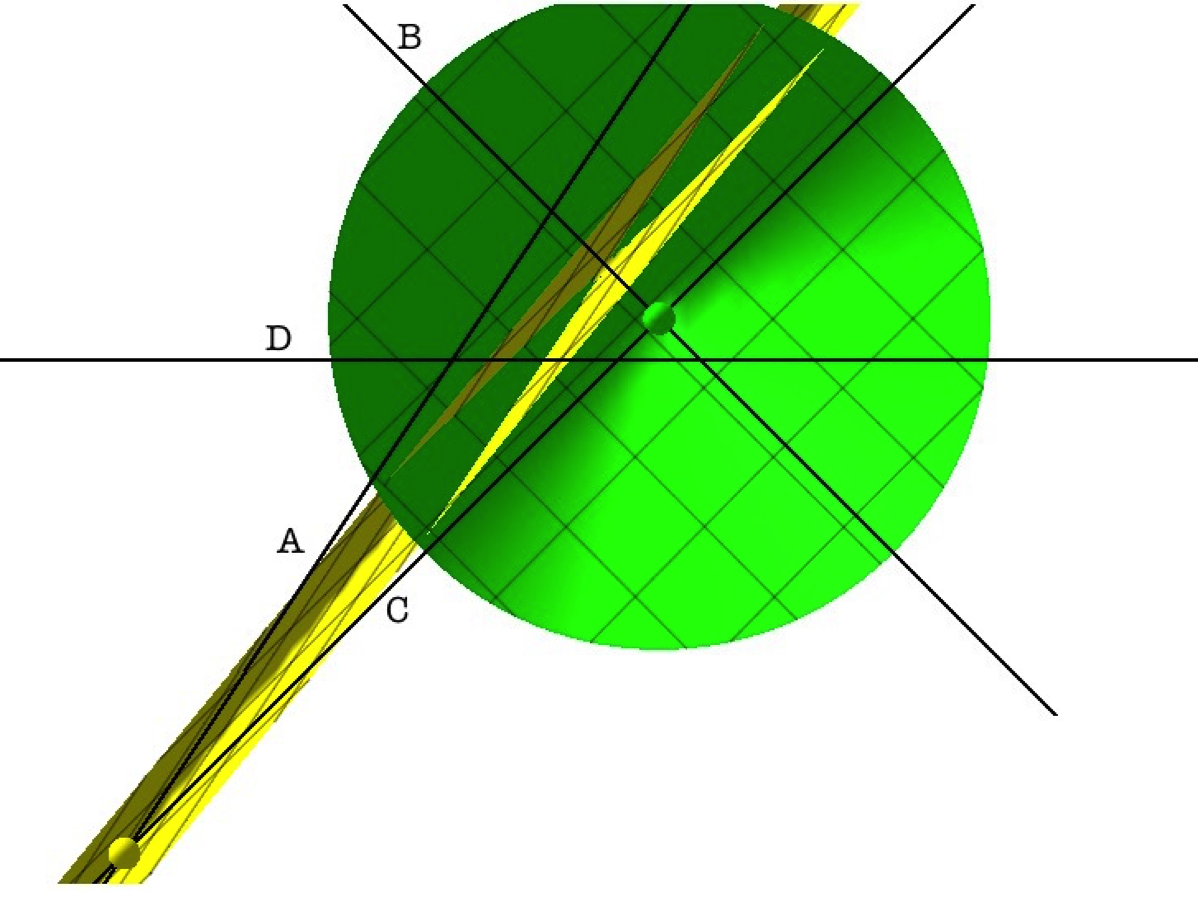
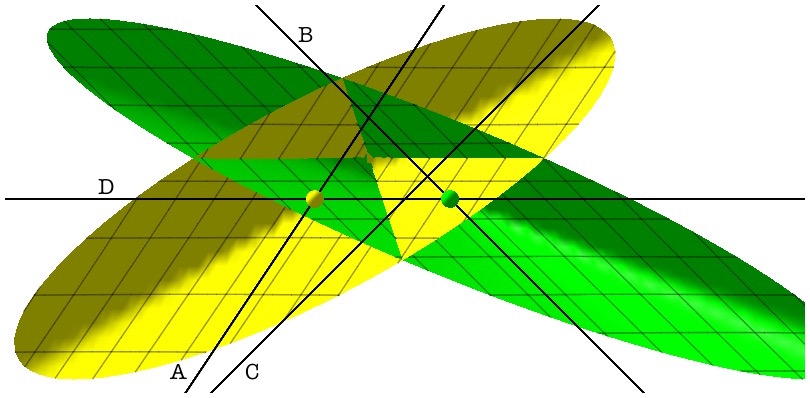
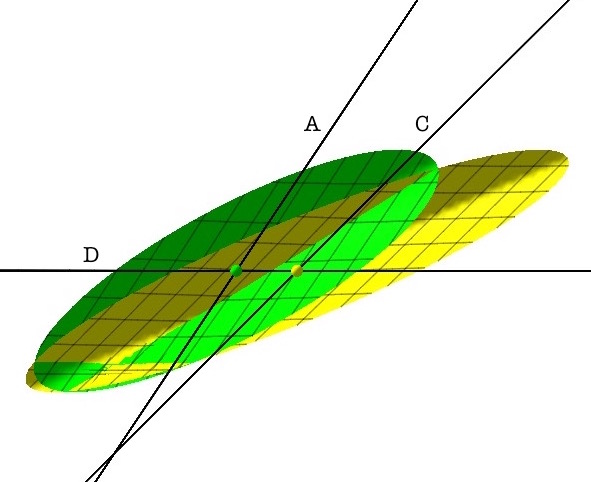
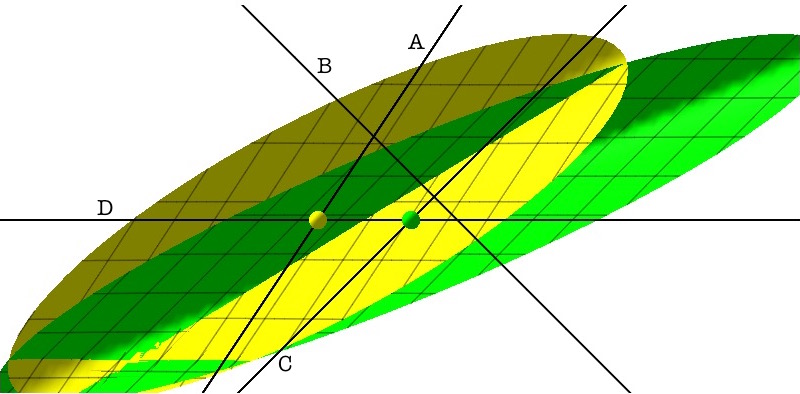
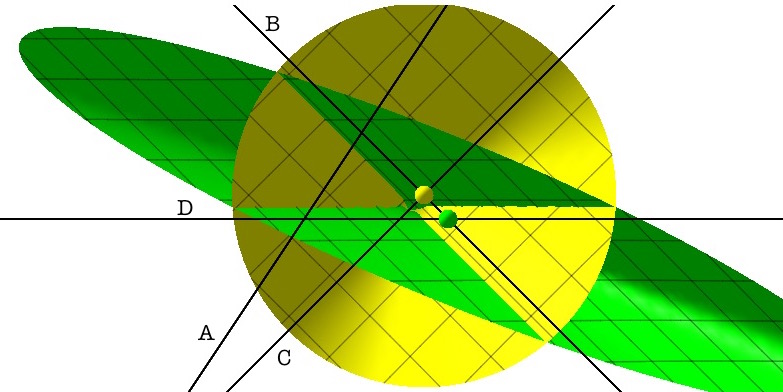
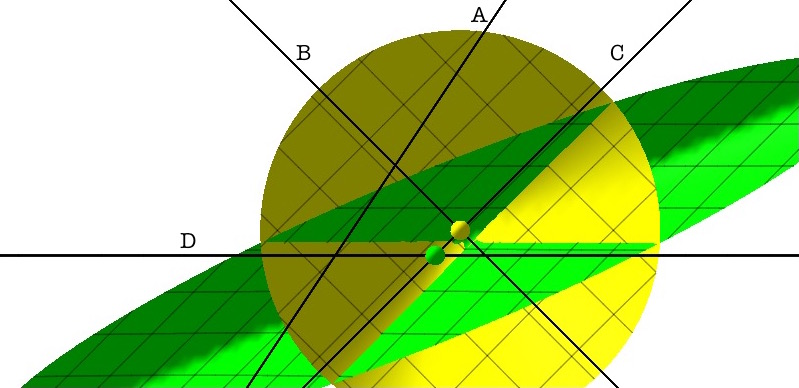
The first series of examples illustrate the rectangle loci for different pairings of four lines A, B, C, D. The rectangle loci are found as in Lemma 4.3 by intersecting the HR-cones generated by the different pairings. For example, the first snapshot involves the intersection of the HR-cones generated by the pairs AB and CD. The snapshot is taken from above, looking directly down into the two HR-cones. (The two cones are only shown below a fixed height.) The four lines are superimposed on the cross-section in order that their relationship to the two cones is more apparent. By Lemma 4.3, the projection to the xy-plane of the intersection of the cones is the rectangle locus for the two pairs. In the first snapshot, this projection is a non-degenerate hyperbola.

AB, CD
Stacks Image 111
AC, BD
Stacks Image 117
AD, BC
Stacks Image 121
AB, AC
Stacks Image 5
AB, AD
Stacks Image 105
AB, BC
Stacks Image 107
AB, BD
Stacks Image 109
AC, AD
Stacks Image 113
AC, BC
Stacks Image 137
AC, DC !


coming soon..

AD, BD
Stacks Image 123
AD, CD
Stacks Image 125
AD, CD
Stacks Image 127
BC, BD
Stacks Image 129
BC, CD
Stacks Image 131
BD, CD


coming soon..

This video illustrates Theorem 5.2. The position and shape of these HR-cones are dictated by the semialgebraic surface in the proof of the theorem and show how different pairs of HR-cones can produce the same hyperbola as a projection of the intersection of the two cones to the plane. This hyperbola would be, as in Corollary 5.3, the rectangle locus for two pairs of lines, namely the pairs comprised of the generating lines of the cones.
The following graph shows a level curve at height 1 of an HR cone and the generating lines of the HR cone. Intersecting with the unit circle locates the cone lines as in Remark 3.7.
Stacks Image 147
The next two graphs show an intersection of two HR-cones. The red curve in the first graph is the intersection of the two cones. In the 2nd graph the cone has been removed to show the space curve that is the intersection of the two cones.
Stacks Image 151
Stacks Image 155
This video shows different views of the space curve in the above two graphs. At 2 seconds, it is clear that the upper left branch does not lie in a plane. (See Remark 4.12.) The video ends with a view directly from above the cones, which shows the projection of the space curve to the xy-plane. This hyperbola in the plane is the rectangle locus for the two pairs of lines (not shown) that are comprised of the generating lines for the two cones.